IWDA vs VUG ETF holdings comparison
iShares Core MSCI World UCITS ETF (USD Acc) (IWDA) · Vanguard Growth ETF (VUG)
IWDA and VUG overlap by 40.1% by portfolio weight. The remaining 59.9 percentage points are not counted as shared holdings weight by this calculation. They share 138 stocks; the largest shared position is Apple (AAPL), contributing 5.73% to the overlap.
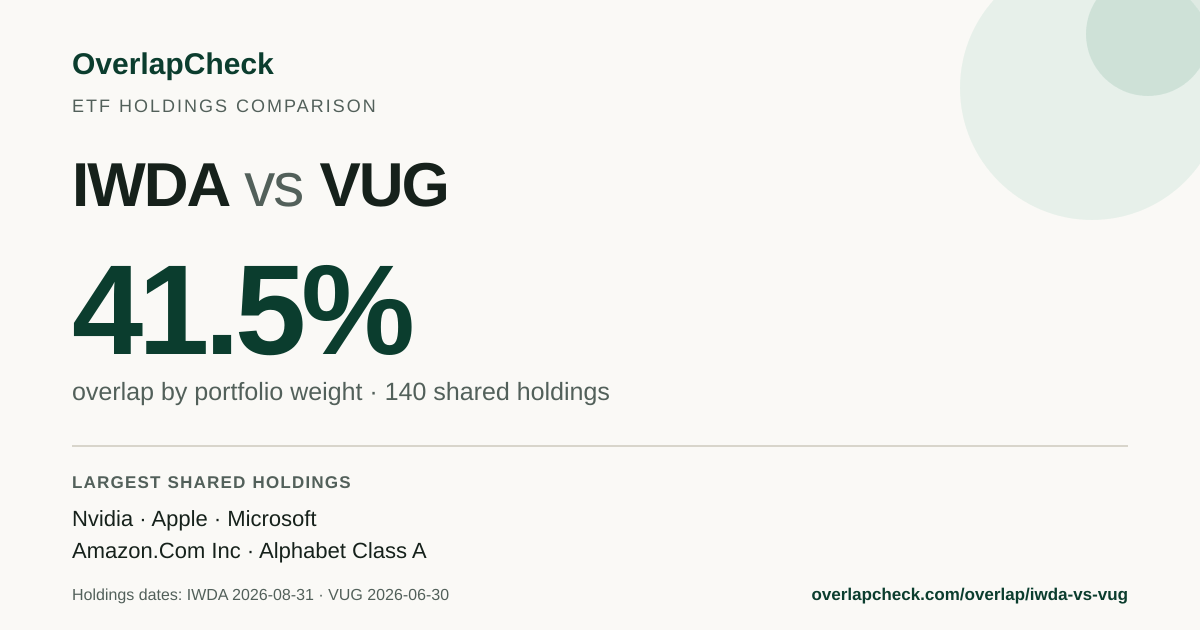
The holdings dates differ. This can slightly understate overlap for funds tracking similar indexes.
What this means
IWDA and VUG share a material portion of their portfolio weight in the same underlying stocks. OverlapCheck labels this "moderate holdings overlap" using house ranges of 70% or more, 30% to under 70%, and under 30%. These descriptive ranges are not industry standards or investment guidance. Holdings overlap does not measure correlation, volatility, geographic or factor exposure, fees, or suitability.
Overlap by weight sums the smaller of the two funds' weights for every stock they both hold. It answers "how much of my money is in the same stocks either way?" See methodology.
This comparison covers normalized equity positions represented in the dataset. Cash, derivatives, options, structured notes, and other non-equity assets are not included, so the result is not a complete comparison of every asset or risk in either fund.
Top shared holdings
| Company | Ticker | in IWDA | in VUG |
|---|---|---|---|
| Apple | AAPL | 5.73% | 11.67% |
| Nvidia | NVDA | 4.74% | 12.63% |
| Microsoft | MSFT | 4.29% | 7.61% |
| Amazon.Com Inc | AMZN | 2.86% | 4.47% |
| Alphabet Class A | GOOGL | 1.88% | 5.76% |
| Meta Platforms Class A | META | 1.51% | 3.41% |
| Alphabet Class C | GOOG | 1.49% | 4.53% |
| Broadcom Inc | AVGO | 1.49% | 4.28% |
| Eli Lilly | LLY | 1.24% | 2.81% |
| Tesla Inc | TSLA | 1.12% | 3.27% |
Holdings only in IWDA or VUG
IWDA has 1070 fund-only positions representing approximately 59.7 percentage points of reported exposure; VUG has 8 fund-only positions representing approximately 0.3 percentage points of reported exposure. These are positions whose normalized security identifiers appear in one issuer file but not the other.
Largest positions only in IWDA
| Company | Ticker | Weight |
|---|---|---|
| Jpmorgan Chase & Co | JPM | 1.02% |
| Berkshire Hathaway Inc Class B | BRK B | 0.92% |
| Micron Technology | MU | 0.84% |
| Exxonmobil Holdings Corp | XOM | 0.78% |
| Johnson & Johnson | JNJ | 0.74% |
| Walmart | WMT | 0.63% |
| Asml Holding | ASML | 0.62% |
| Abbvie | ABBV | 0.58% |
| Chevron | CVX | 0.44% |
| Procter & Gamble | PG | 0.44% |
Largest positions only in VUG
| Company | Ticker | Weight |
|---|---|---|
| HEICO Corp | HEIA | 0.06% |
| Atlassian Corp | TEAM1EUR | 0.05% |
| Cerebras Systems Inc | CBRS | 0.04% |
| TKO Group Holdings Inc | TKO | 0.03% |
| CoStar Group Inc | CSGP | 0.03% |
| Lululemon Athletica Inc | LULU | 0.03% |
| Symbotic Inc | SYM | 0.02% |
| Venture Global Inc | VG | 0.02% |
FAQ
How much do IWDA and VUG overlap?
IWDA and VUG have 40.1% overlap by weight, sharing 138 equity positions (out of 1208 in IWDA and 146 in VUG). The official holdings files used are dated 2026-11-05 for IWDA and 2026-06-30 for VUG.
What does 40.1% overlap mean?
IWDA and VUG share a material portion of their portfolio weight in the same underlying stocks. OverlapCheck labels this "moderate holdings overlap" using house ranges of 70% or more, 30% to under 70%, and under 30%. These descriptive ranges are not industry standards or investment guidance. Holdings overlap does not measure correlation, volatility, geographic or factor exposure, fees, or suitability.
Which stocks do IWDA and VUG both hold?
The largest shared positions are Apple, Nvidia, Microsoft, Amazon.Com Inc, Alphabet Class A. The top shared holdings with weights in each fund are shown on this page.
What holdings are different between IWDA and VUG?
IWDA has 1070 positions not found in VUG, while VUG has 8 positions not found in IWDA. The largest fund-only positions and their weights are shown on this page.
Related comparisons
One side of this pair is a UCITS ETF. How share classes and listings map to one fund, and which popular UCITS combinations repeat the same US mega-caps, is covered in ETF overlap for European investors.