VEA vs VIG ETF holdings comparison
Vanguard FTSE Developed Markets ETF (VEA) · Vanguard Dividend Appreciation ETF (VIG)
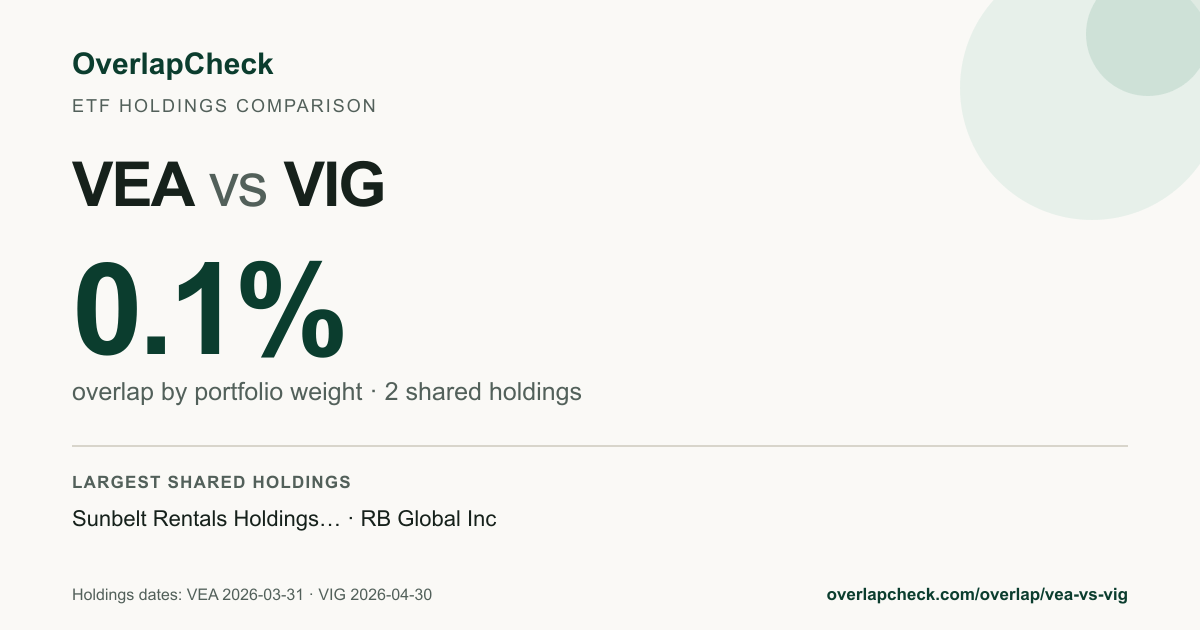
VEA and VIG overlap by 0.2% by portfolio weight. The remaining 99.8 percentage points are not counted as shared holdings weight by this calculation. They share 2 stocks; the largest shared position is Sunbelt Rentals Holdings Inc (SUNB), contributing 0.09% to the overlap.
The holdings dates differ. This can slightly understate overlap for funds tracking similar indexes.
What this means
VEA and VIG share a smaller portion of their portfolio weight in the same underlying stocks. OverlapCheck labels this "low holdings overlap" using house ranges of 70% or more, 30% to under 70%, and under 30%. These descriptive ranges are not industry standards or investment guidance. Holdings overlap does not measure correlation, volatility, geographic or factor exposure, fees, or suitability.
Overlap by weight sums the smaller of the two funds' weights for every stock they both hold. It answers "how much of my money is in the same stocks either way?" See methodology.
This comparison covers normalized equity positions represented in the dataset. Cash, derivatives, options, structured notes, and other non-equity assets are not included, so the result is not a complete comparison of every asset or risk in either fund.
Top shared holdings
| Company | Ticker | in VEA | in VIG |
|---|---|---|---|
| Sunbelt Rentals Holdings Inc | SUNB | 0.09% | 0.14% |
| RB Global Inc | RBA | 0.07% | 0.09% |
Holdings only in VEA or VIG
VEA has 3826 fund-only positions representing approximately 98.9 percentage points of reported exposure; VIG has 330 fund-only positions representing approximately 99.1 percentage points of reported exposure. These are positions whose normalized security identifiers appear in one issuer file but not the other.
Largest positions only in VEA
| Company | Ticker | Weight |
|---|---|---|
| Samsung Electronics Co Ltd | N/A | 3.17% |
| SK hynix Inc | N/A | 3.02% |
| ASML Holding NV | N/A | 2.36% |
| HSBC Holdings PLC | N/A | 1.00% |
| Novartis AG | N/A | 0.90% |
| Royal Bank of Canada | RY | 0.90% |
| Roche Holding AG | N/A | 0.89% |
| AstraZeneca PLC | N/A | 0.87% |
| Nestle SA | N/A | 0.82% |
| Siemens AG | N/A | 0.73% |
Largest positions only in VIG
| Company | Ticker | Weight |
|---|---|---|
| Broadcom Inc | AVGO | 5.18% |
| Apple Inc | AAPL | 4.07% |
| Microsoft Corp | MSFT | 3.97% |
| JPMorgan Chase & Co | JPM | 3.59% |
| Eli Lilly & Co | LLY | 3.34% |
| Exxon Mobil Corp | XOM | 2.90% |
| Walmart Inc | WMT | 2.60% |
| Johnson & Johnson | JNJ | 2.49% |
| Visa Inc | V | 2.33% |
| Costco Wholesale Corp | COST | 2.03% |
FAQ
How much do VEA and VIG overlap?
VEA and VIG have 0.2% overlap by weight, sharing 2 equity positions (out of 3828 in VEA and 332 in VIG). The official holdings files used are dated 2026-06-30 for VEA and 2026-04-30 for VIG.
What does 0.2% overlap mean?
VEA and VIG share a smaller portion of their portfolio weight in the same underlying stocks. OverlapCheck labels this "low holdings overlap" using house ranges of 70% or more, 30% to under 70%, and under 30%. These descriptive ranges are not industry standards or investment guidance. Holdings overlap does not measure correlation, volatility, geographic or factor exposure, fees, or suitability.
Which stocks do VEA and VIG both hold?
The largest shared positions are Sunbelt Rentals Holdings Inc, RB Global Inc. The top shared holdings with weights in each fund are shown on this page.
What holdings are different between VEA and VIG?
VEA has 3826 positions not found in VIG, while VIG has 330 positions not found in VEA. The largest fund-only positions and their weights are shown on this page.