IJR vs JEPQ ETF holdings comparison
iShares Core S&P Small-Cap ETF (IJR) · JPMorgan Nasdaq Equity Premium Income ETF (JEPQ)
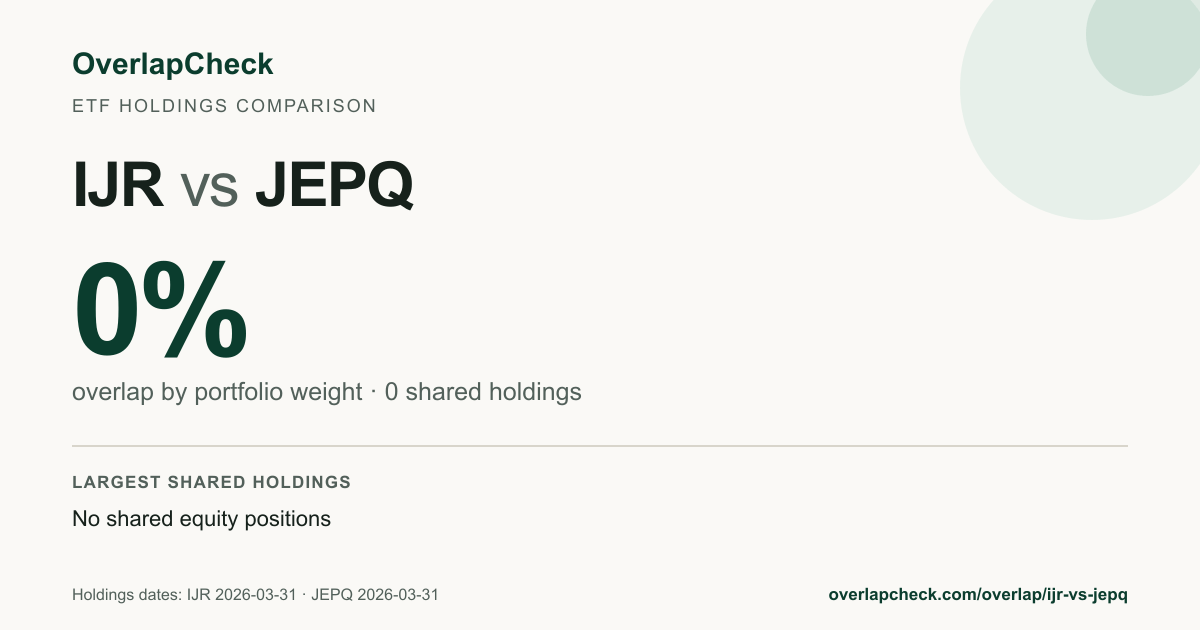
IJR and JEPQ overlap by 0% by portfolio weight. The remaining 100.0 percentage points are not counted as shared holdings weight by this calculation. They share 0 stocks;
What this means
IJR and JEPQ share a smaller portion of their portfolio weight in the same underlying stocks. OverlapCheck labels this "low holdings overlap" using house ranges of 70% or more, 30% to under 70%, and under 30%. These descriptive ranges are not industry standards or investment guidance. Holdings overlap does not measure correlation, volatility, geographic or factor exposure, fees, or suitability.
Overlap by weight sums the smaller of the two funds' weights for every stock they both hold. It answers "how much of my money is in the same stocks either way?" See methodology.
This comparison covers normalized equity positions represented in the dataset. Cash, derivatives, options, structured notes, and other non-equity assets are not included, so the result is not a complete comparison of every asset or risk in either fund.
Top shared holdings
No shared stocks were found in the normalized issuer holdings used for this comparison. That result applies only to the holdings files and dates shown above.
Holdings only in IJR or JEPQ
IJR has 601 fund-only positions representing approximately 97.7 percentage points of reported exposure; JEPQ has 94 fund-only positions representing approximately 82.3 percentage points of reported exposure. These are positions whose normalized security identifiers appear in one issuer file but not the other.
Largest positions only in IJR
| Company | Ticker | Weight |
|---|---|---|
| FORMFACTOR INC | FORM | 0.67% |
| VIASAT INC | VSAT | 0.66% |
| MOLINA HEALTHCARE INC | MOH | 0.64% |
| ARGAN INC | AGX | 0.60% |
| BRIGHTSPRING HEALTH SERVICES INC | BTSG | 0.60% |
| ELEMENT SOLUTIONS INC | ESI | 0.59% |
| MAXLINEAR INC | MXL | 0.58% |
| KRYSTAL BIOTECH INC | KRYS | 0.53% |
| ESCO TECHNOLOGIES INC | ESE | 0.49% |
| MATCH GROUP INC | MTCH | 0.48% |
Largest positions only in JEPQ
| Company | Ticker | Weight |
|---|---|---|
| NVIDIA Corp. | NVDA | 6.59% |
| Apple, Inc. | AAPL | 5.74% |
| Micron Technology, Inc. | MU | 5.50% |
| Alphabet, Inc. | GOOG | 4.98% |
| Microsoft Corp. | MSFT | 3.84% |
| Advanced Micro Devices, Inc. | AMD | 3.81% |
| Amazon.com, Inc. | AMZN | 3.62% |
| Lam Research Corp. | LRCX | 2.85% |
| Tesla, Inc. | TSLA | 2.36% |
| Meta Platforms, Inc. | META | 2.35% |
FAQ
How much do IJR and JEPQ overlap?
IJR and JEPQ have 0% overlap by weight, sharing 0 equity positions (out of 601 in IJR and 94 in JEPQ). The official holdings files used are dated 2026-06-30 for IJR and 2026-06-30 for JEPQ.
What does 0% overlap mean?
IJR and JEPQ share a smaller portion of their portfolio weight in the same underlying stocks. OverlapCheck labels this "low holdings overlap" using house ranges of 70% or more, 30% to under 70%, and under 30%. These descriptive ranges are not industry standards or investment guidance. Holdings overlap does not measure correlation, volatility, geographic or factor exposure, fees, or suitability.
Which stocks do IJR and JEPQ both hold?
IJR and JEPQ have no shared stock positions in the normalized issuer holdings used for this comparison.
What holdings are different between IJR and JEPQ?
IJR has 601 positions not found in JEPQ, while JEPQ has 94 positions not found in IJR. The largest fund-only positions and their weights are shown on this page.