VOO vs IVV ETF holdings comparison
Vanguard S&P 500 ETF (VOO) · iShares Core S&P 500 ETF (IVV)
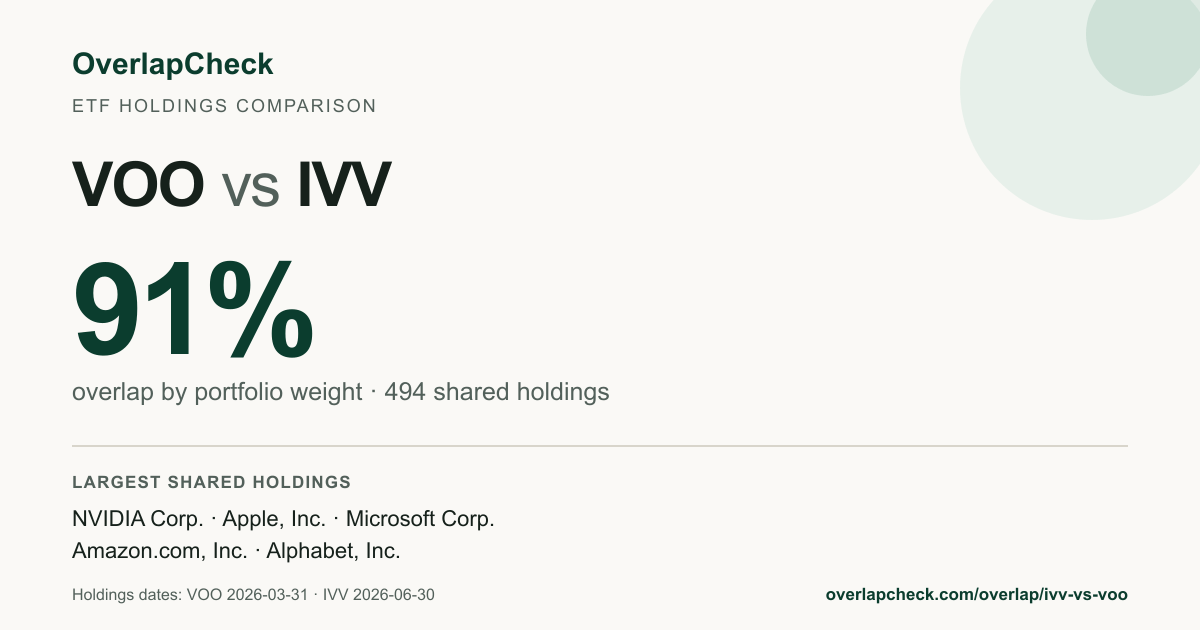
VOO and IVV overlap by 99.6% by portfolio weight. The remaining 0.4 percentage points are not counted as shared holdings weight by this calculation. They share 503 stocks; the largest shared position is NVIDIA Corp. (NVDA), contributing 7.51% to the overlap.
What this means
VOO and IVV share most of their portfolio weight in the same underlying stocks. OverlapCheck labels this "high holdings overlap" using house ranges of 70% or more, 30% to under 70%, and under 30%. These descriptive ranges are not industry standards or investment guidance. Holdings overlap does not measure correlation, volatility, geographic or factor exposure, fees, or suitability.
Overlap by weight sums the smaller of the two funds' weights for every stock they both hold. It answers "how much of my money is in the same stocks either way?" See methodology.
This comparison covers normalized equity positions represented in the dataset. Cash, derivatives, options, structured notes, and other non-equity assets are not included, so the result is not a complete comparison of every asset or risk in either fund.
VOO vs IVV: key differences
VOO and IVV provide almost the same underlying stock exposure. Both are passive S&P 500 funds and both currently report a 0.03% expense ratio. The clearest fixed differences are the sponsor and fund history: Vanguard launched VOO in 2010, while iShares launched IVV in 2000. Trading price, assets, spreads, and tax-lot consequences can change and should be checked with the issuer and your broker.
| Fund | Sponsor | Benchmark | Expense ratio | Inception | Holdings here |
|---|---|---|---|---|---|
| VOO | Vanguard | S&P 500 Index | 0.03% | 2010-09-07 | 504 |
| IVV | BlackRock (iShares) | S&P 500 Index | 0.03% | 2000-05-15 | 503 |
Fixed fund facts verified against Vanguard's VOO profile and iShares' IVV profile. Holdings counts use the normalized holdings data in this analysis.
What drives the 99.6% overlap?
The two holdings datasets share 503 normalized positions, equal to 99.8% of their combined holdings set. NVIDIA, Apple, and Microsoft alone contribute 18.38 percentage points of overlap, or 18.5% of the total overlap score. The remaining overlap is broad rather than confined to a few mega-cap stocks: almost the entire S&P 500 basket appears in both funds at nearly matching weights.
Do VOO and IVV have different sector exposure?
Only marginally in these holdings data. The table shows the largest measured differences; small gaps can reflect rounding, cash or derivative positions, and filing timing rather than a different investment objective.
| Sector | VOO | IVV | Difference |
|---|---|---|---|
| Financials | 11.6% | 11.7% | 0.1 pts |
| Technology | 37.8% | 37.7% | 0.1 pts |
| Communication Services | 9.7% | 9.7% | 0.0 pts |
| Consumer Discretionary | 9.3% | 9.3% | 0.0 pts |
| Industrials | 8.9% | 8.9% | 0.0 pts |
| Health Care | 8.9% | 8.9% | 0.0 pts |
Top shared holdings
| Company | Ticker | in VOO | in IVV |
|---|---|---|---|
| NVIDIA Corp. | NVDA | 7.51% | 7.51% |
| Apple, Inc. | AAPL | 6.59% | 6.58% |
| Microsoft Corp. | MSFT | 4.30% | 4.29% |
| Amazon.com, Inc. | AMZN | 3.62% | 3.61% |
| Alphabet, Inc. | GOOGL | 3.25% | 3.25% |
| Broadcom, Inc. | AVGO | 2.77% | 2.77% |
| Alphabet, Inc. | GOOG | 2.59% | 2.59% |
| Micron Technology, Inc. | MU | 2.02% | 2.02% |
| Meta Platforms, Inc. | META | 1.92% | 1.92% |
| Tesla, Inc. | TSLA | 1.84% | 1.83% |
Holdings only in VOO or IVV
VOO has 1 fund-only positions representing approximately <0.1 percentage points of reported exposure; IVV has 0 fund-only positions representing approximately 0.0 percentage points of reported exposure. These are positions whose normalized security identifiers appear in one issuer file but not the other.
Largest positions only in VOO
| Company | Ticker | Weight |
|---|---|---|
| Conagra Brands Inc | CAG | <0.01% |
Largest positions only in IVV
No fund-only positions in this holdings snapshot.
FAQ
How much do VOO and IVV overlap?
VOO and IVV have 99.6% overlap by weight, sharing 503 equity positions (out of 504 in VOO and 503 in IVV). The official holdings files used are dated 2026-06-30 for VOO and 2026-06-30 for IVV.
What does 99.6% overlap mean?
VOO and IVV share most of their portfolio weight in the same underlying stocks. OverlapCheck labels this "high holdings overlap" using house ranges of 70% or more, 30% to under 70%, and under 30%. These descriptive ranges are not industry standards or investment guidance. Holdings overlap does not measure correlation, volatility, geographic or factor exposure, fees, or suitability.
Which stocks do VOO and IVV both hold?
The largest shared positions are NVIDIA Corp., Apple, Inc., Microsoft Corp., Amazon.com, Inc., Alphabet, Inc.. The top shared holdings with weights in each fund are shown on this page.
What holdings are different between VOO and IVV?
VOO has 1 positions not found in IVV, while IVV has 0 positions not found in VOO. The largest fund-only positions and their weights are shown on this page.
Are VOO and IVV basically the same ETF?
VOO and IVV both track the S&P 500, charge a 0.03% expense ratio, and overlap by 99.6% by portfolio weight in this dataset. Their holdings exposure is therefore nearly identical; the principal fixed differences are fund sponsor and inception date.
Which is cheaper, VOO or IVV?
Neither is cheaper by stated expense ratio: Vanguard reports 0.03% for VOO and iShares reports 0.03% for IVV in their current official fund materials.